Asset Network
The partial correlation network derived from price data provides valuable insights into the relationships between stocks in the financial markets. At the heart of this method lies the “graphical lasso” algorithm, which effectively reduces the size of the network and highlights it’s most important elements.
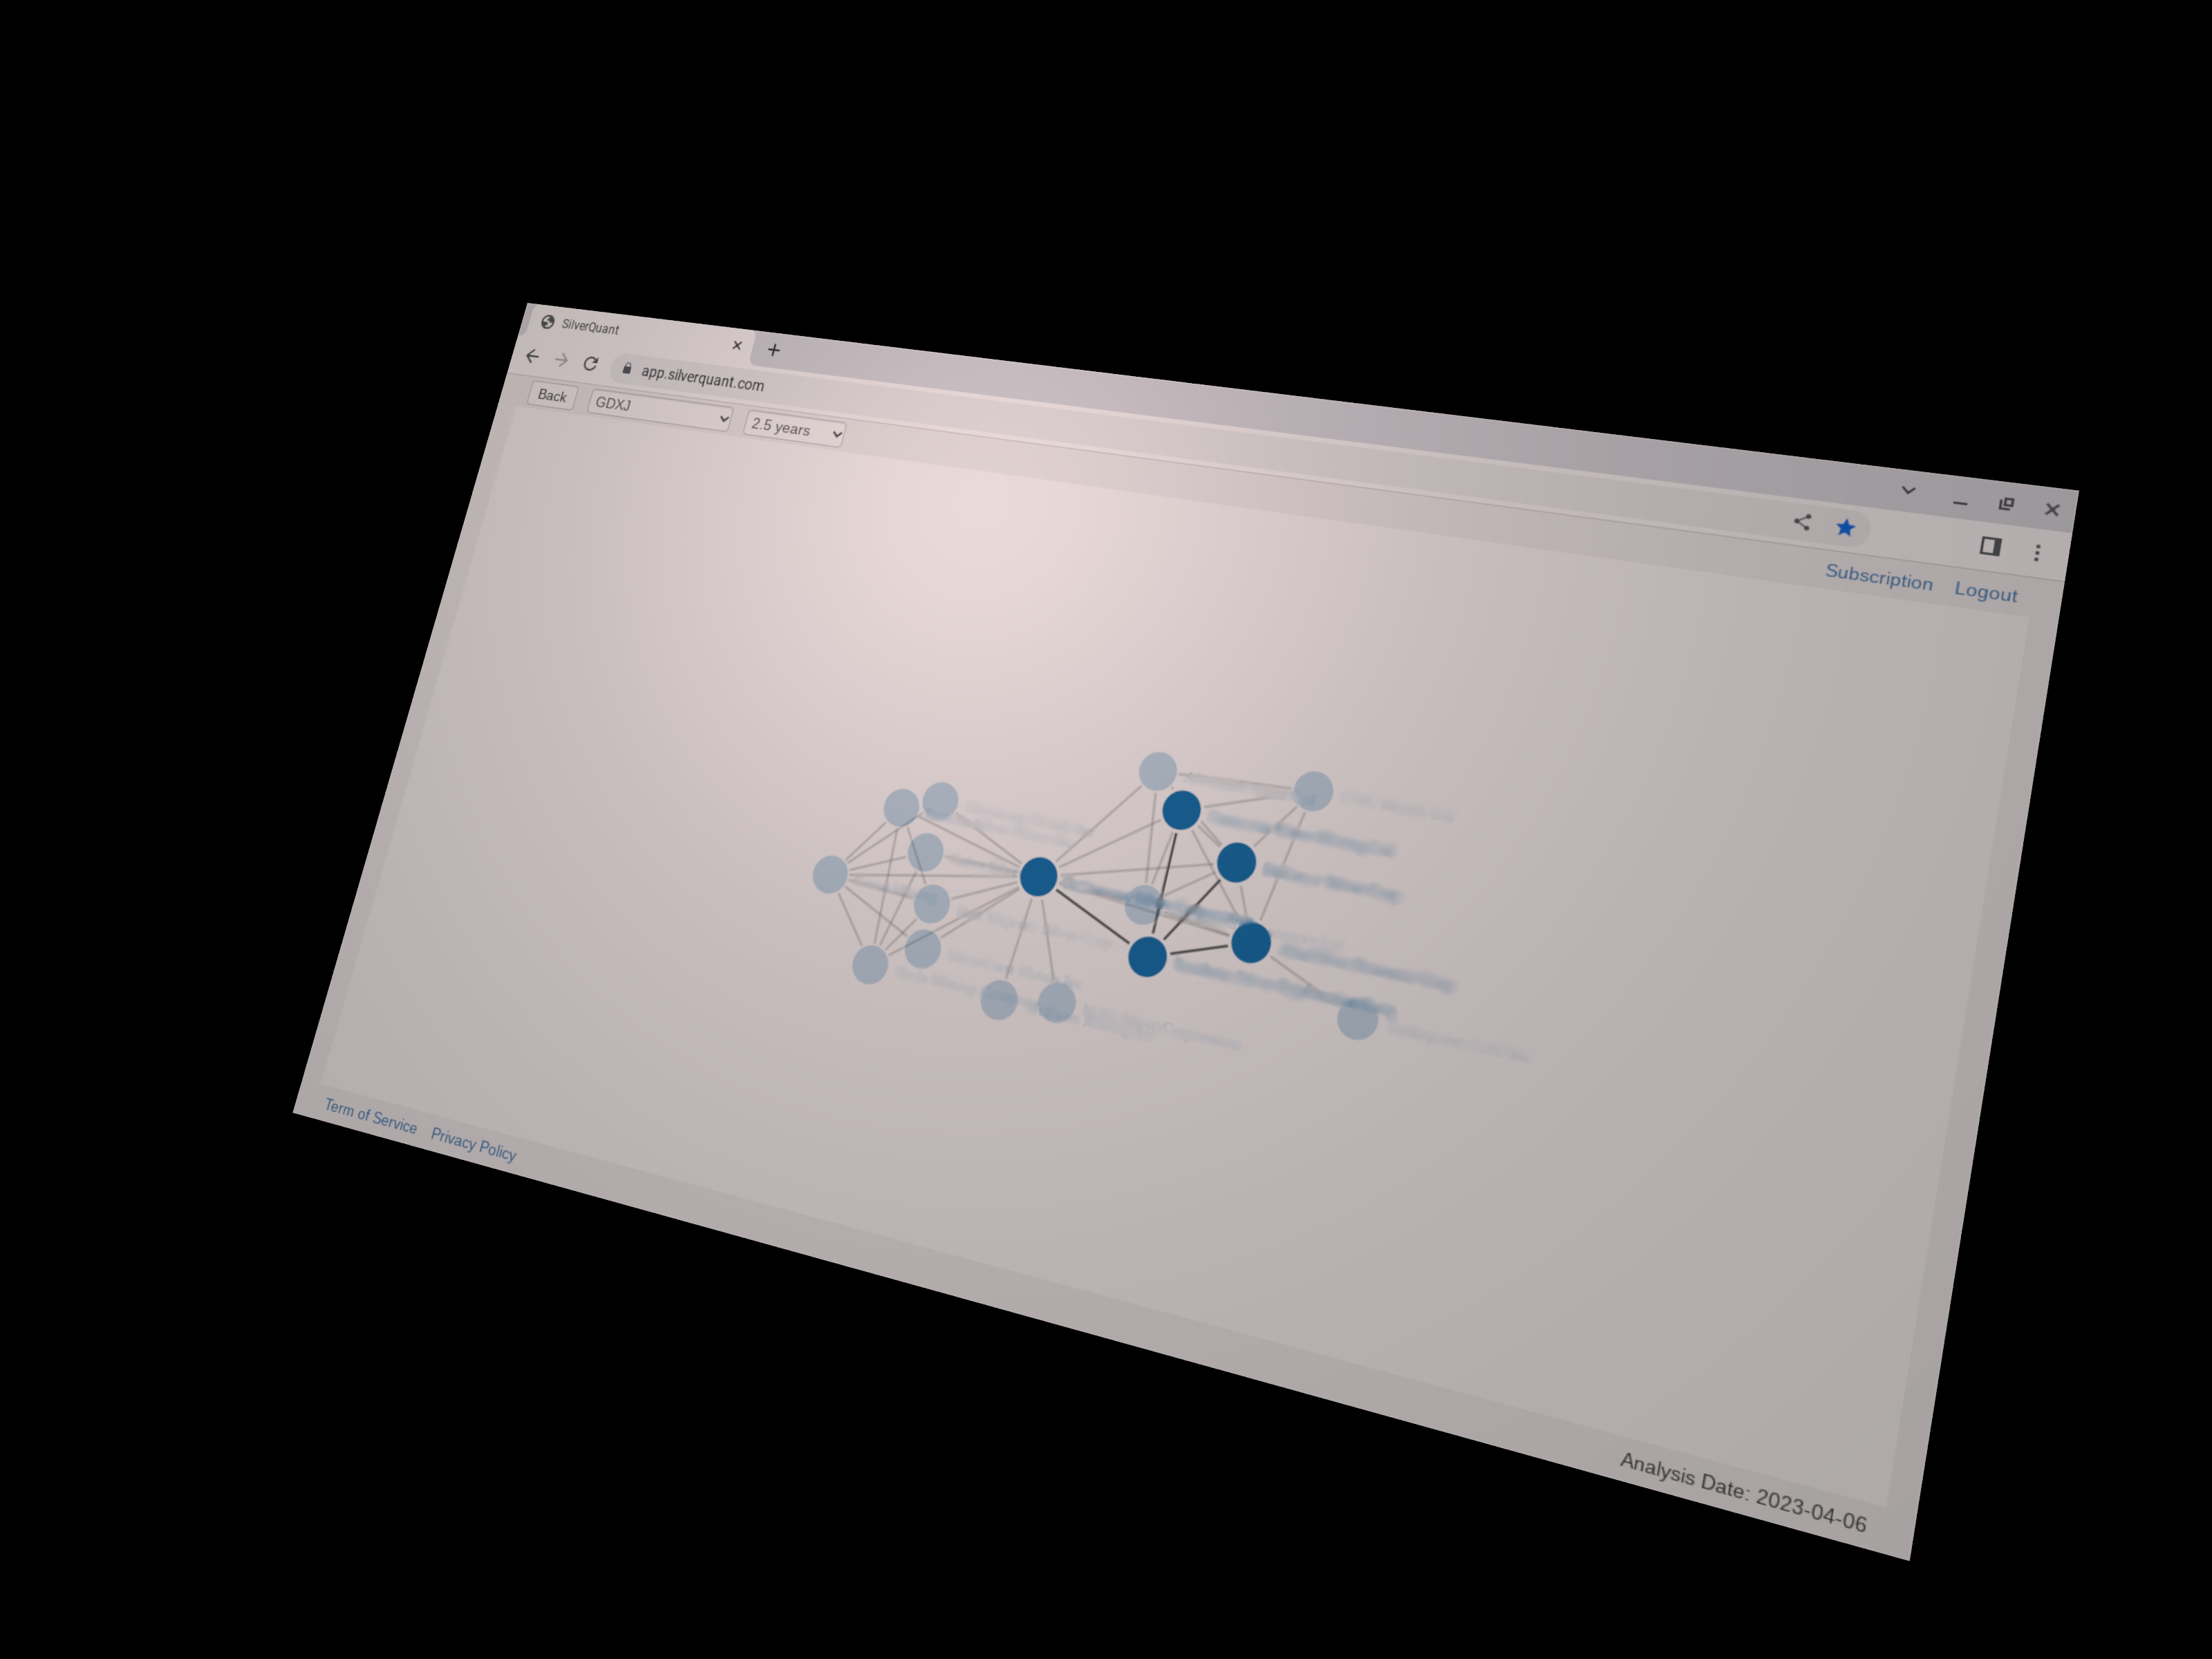
By utilizing this technique, we can create a striking visual representation of the relationships between stocks that make up a given market. This visualization makes it easy to identify key drivers of market trends and to spot opportunities for investment.
One of the key advantages of our partial correlation network is the interactive visualization, which allows users to explore the network in real time. We offer controls that allow analysts to explore different network sizes in an interactive way. This enables them to adjust the analysis to fit their specific needs and to discover more granular details within the network.
With our interactive network visualization, analysts can easily explore and understand the complex relationships between mining stocks, gaining a better understanding of market dynamics and potentially identifying new investment opportunities.
Sign Up Now
Contact us at silverquant.info@gmail.com